

Metrology concepts
Even in the absence of radioactivity in the sample being measured, measurement devices provide a result that can be affected, depending on the technique used, by the radiation (particularly natural) to which the detector is exposed, the composition of the sample being measured (chemical reagents, sampling medium, etc.), and by the inherent noise of the measurement device. Furthermore, the presence of "interfering elements" (chemical elements or radionuclides other than those being sought, which disrupt the measurement) can lead to a degradation in the ability to determine the sample's activity.
These various components fluctuate and are partly random ("noise"). Therefore, when the sample's activity is very low, it is difficult to determine the portion of detections related to the sample from the fluctuation of background noise related to the measurement
It is therefore the metrologist's responsibility to determine whether the count can be attributed to the sample itself or whether it cannot be distinguished from other events related to the measurement environment and the instrument itself. This is defined as the decision threshold (DT), which is the minimum measurement value required to attribute the presence of the phenomenon to the sample with a high level of certainty. This threshold is independent of the sample itself, and its calculation method is established by international standards.
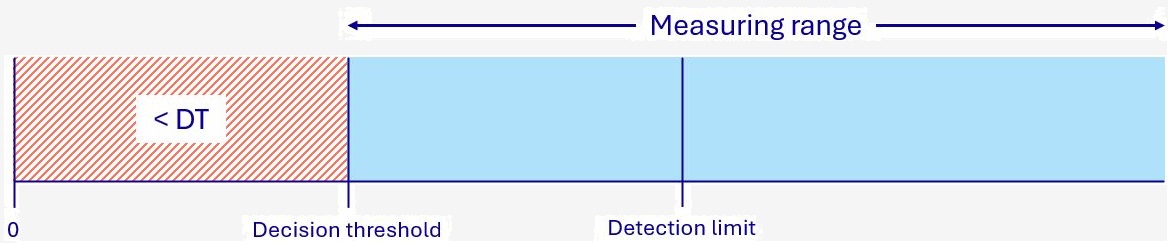
The detection limit (or limit of detection, LOD) is the smallest true value of the quantity to be measured (e.g., activity) for which the probability of wrongly deciding that the phenomenon is absent does not exceed the specified probability (e.g., 5% error in considering that the measured radioactivity does not come from the sample when it really does).
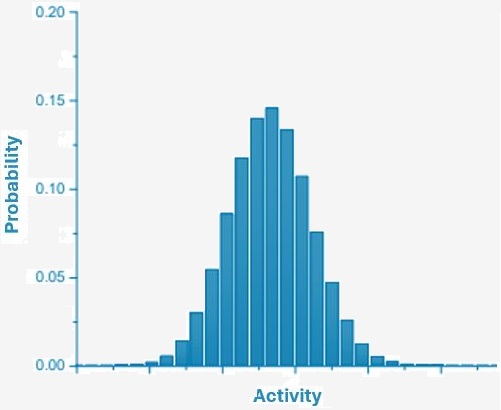
If the activity is above the standard deviation (SD), then we speak of a significant measurement, meaning that it is possible to accurately represent an activity, along with a measurement uncertainty and a confidence interval. This uncertainty reflects the fact that there is no exact measurement of activity, precisely because of the measurement environment and the fact that the instrument always influences the measurement and involves an element of randomness (measurement is a probabilistic phenomenon). If the same measurement is repeated many times on a sample, the result will be more or less different each time, while remaining statistically centered on a value (Gaussian distribution), which will be the reported activity. The uncertainty therefore reflects this "dispersion" around the activity.
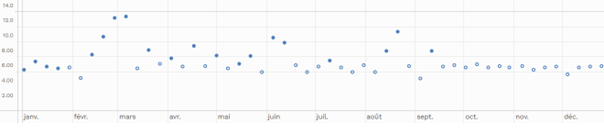
If, on the other hand, the activity is below the decision threshold, then the metrologist cannot assign a value to the activity; they can only state that it is below the decision threshold. The measurement result is then considered non-significant and reported as below the SD. Non-significant values are represented in the RNM as empty circles.
The activities of most radionuclides in the environment are very low, so measurement series often include results below the decision threshold. This information remains important, however, as it provides information on the maximum activity present in the sample and, with appropriate statistical rules, allows for the analysis of measurement data (as it is the case, for example, in the reports on the radiological state of the French environment).
Measurement uncertainty, specific to a method, is a parameter associated with the result of a meaningful measurement. It describes the range of possible values within which the true value lies, with a predefined probability. Measurement uncertainty arises from the properties of the instrument, the operator, the measurement environment (temperature, vibrations, etc.), the measurement procedure, and so on. The value read on the measuring instrument can fall within the entire measurement uncertainty range and therefore be more or less close to the true value of the measured quantity.
For the sake of clarity, measurement uncertainties are not shown in the graphs on this site but are available in the datasets.
To learn more, see the animation below: